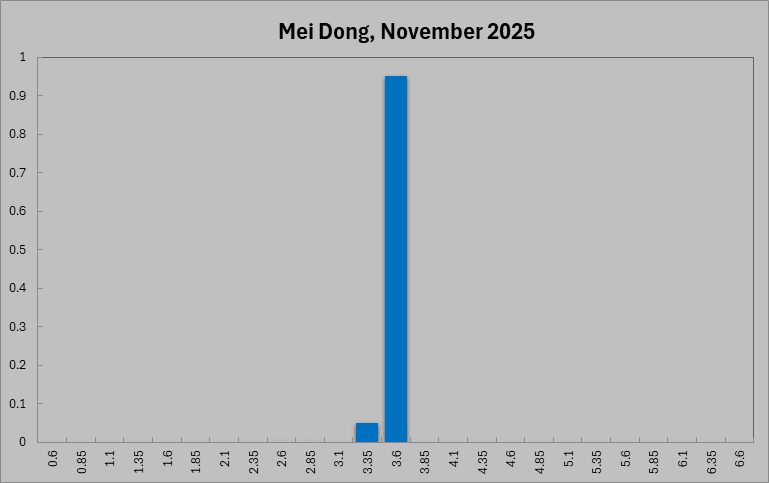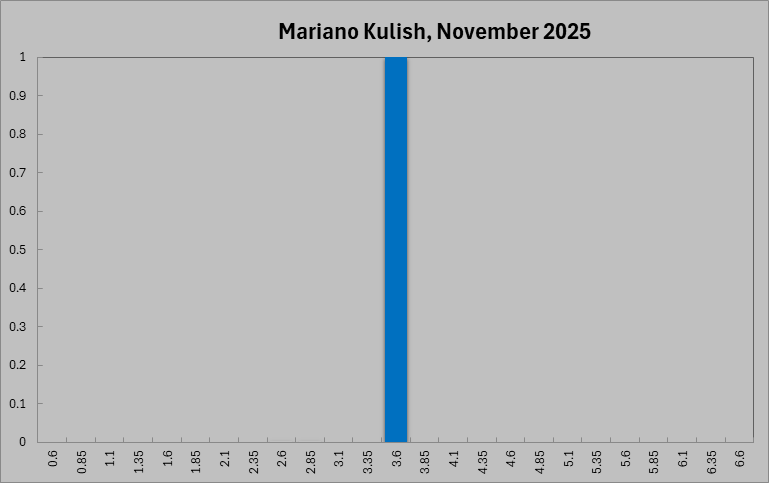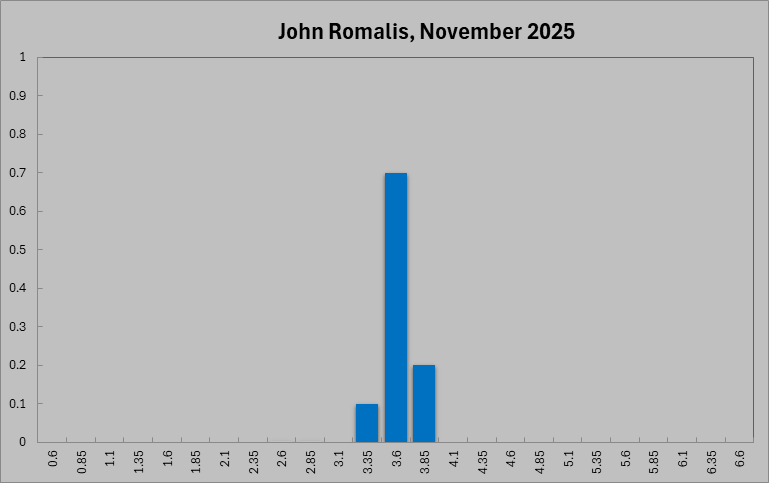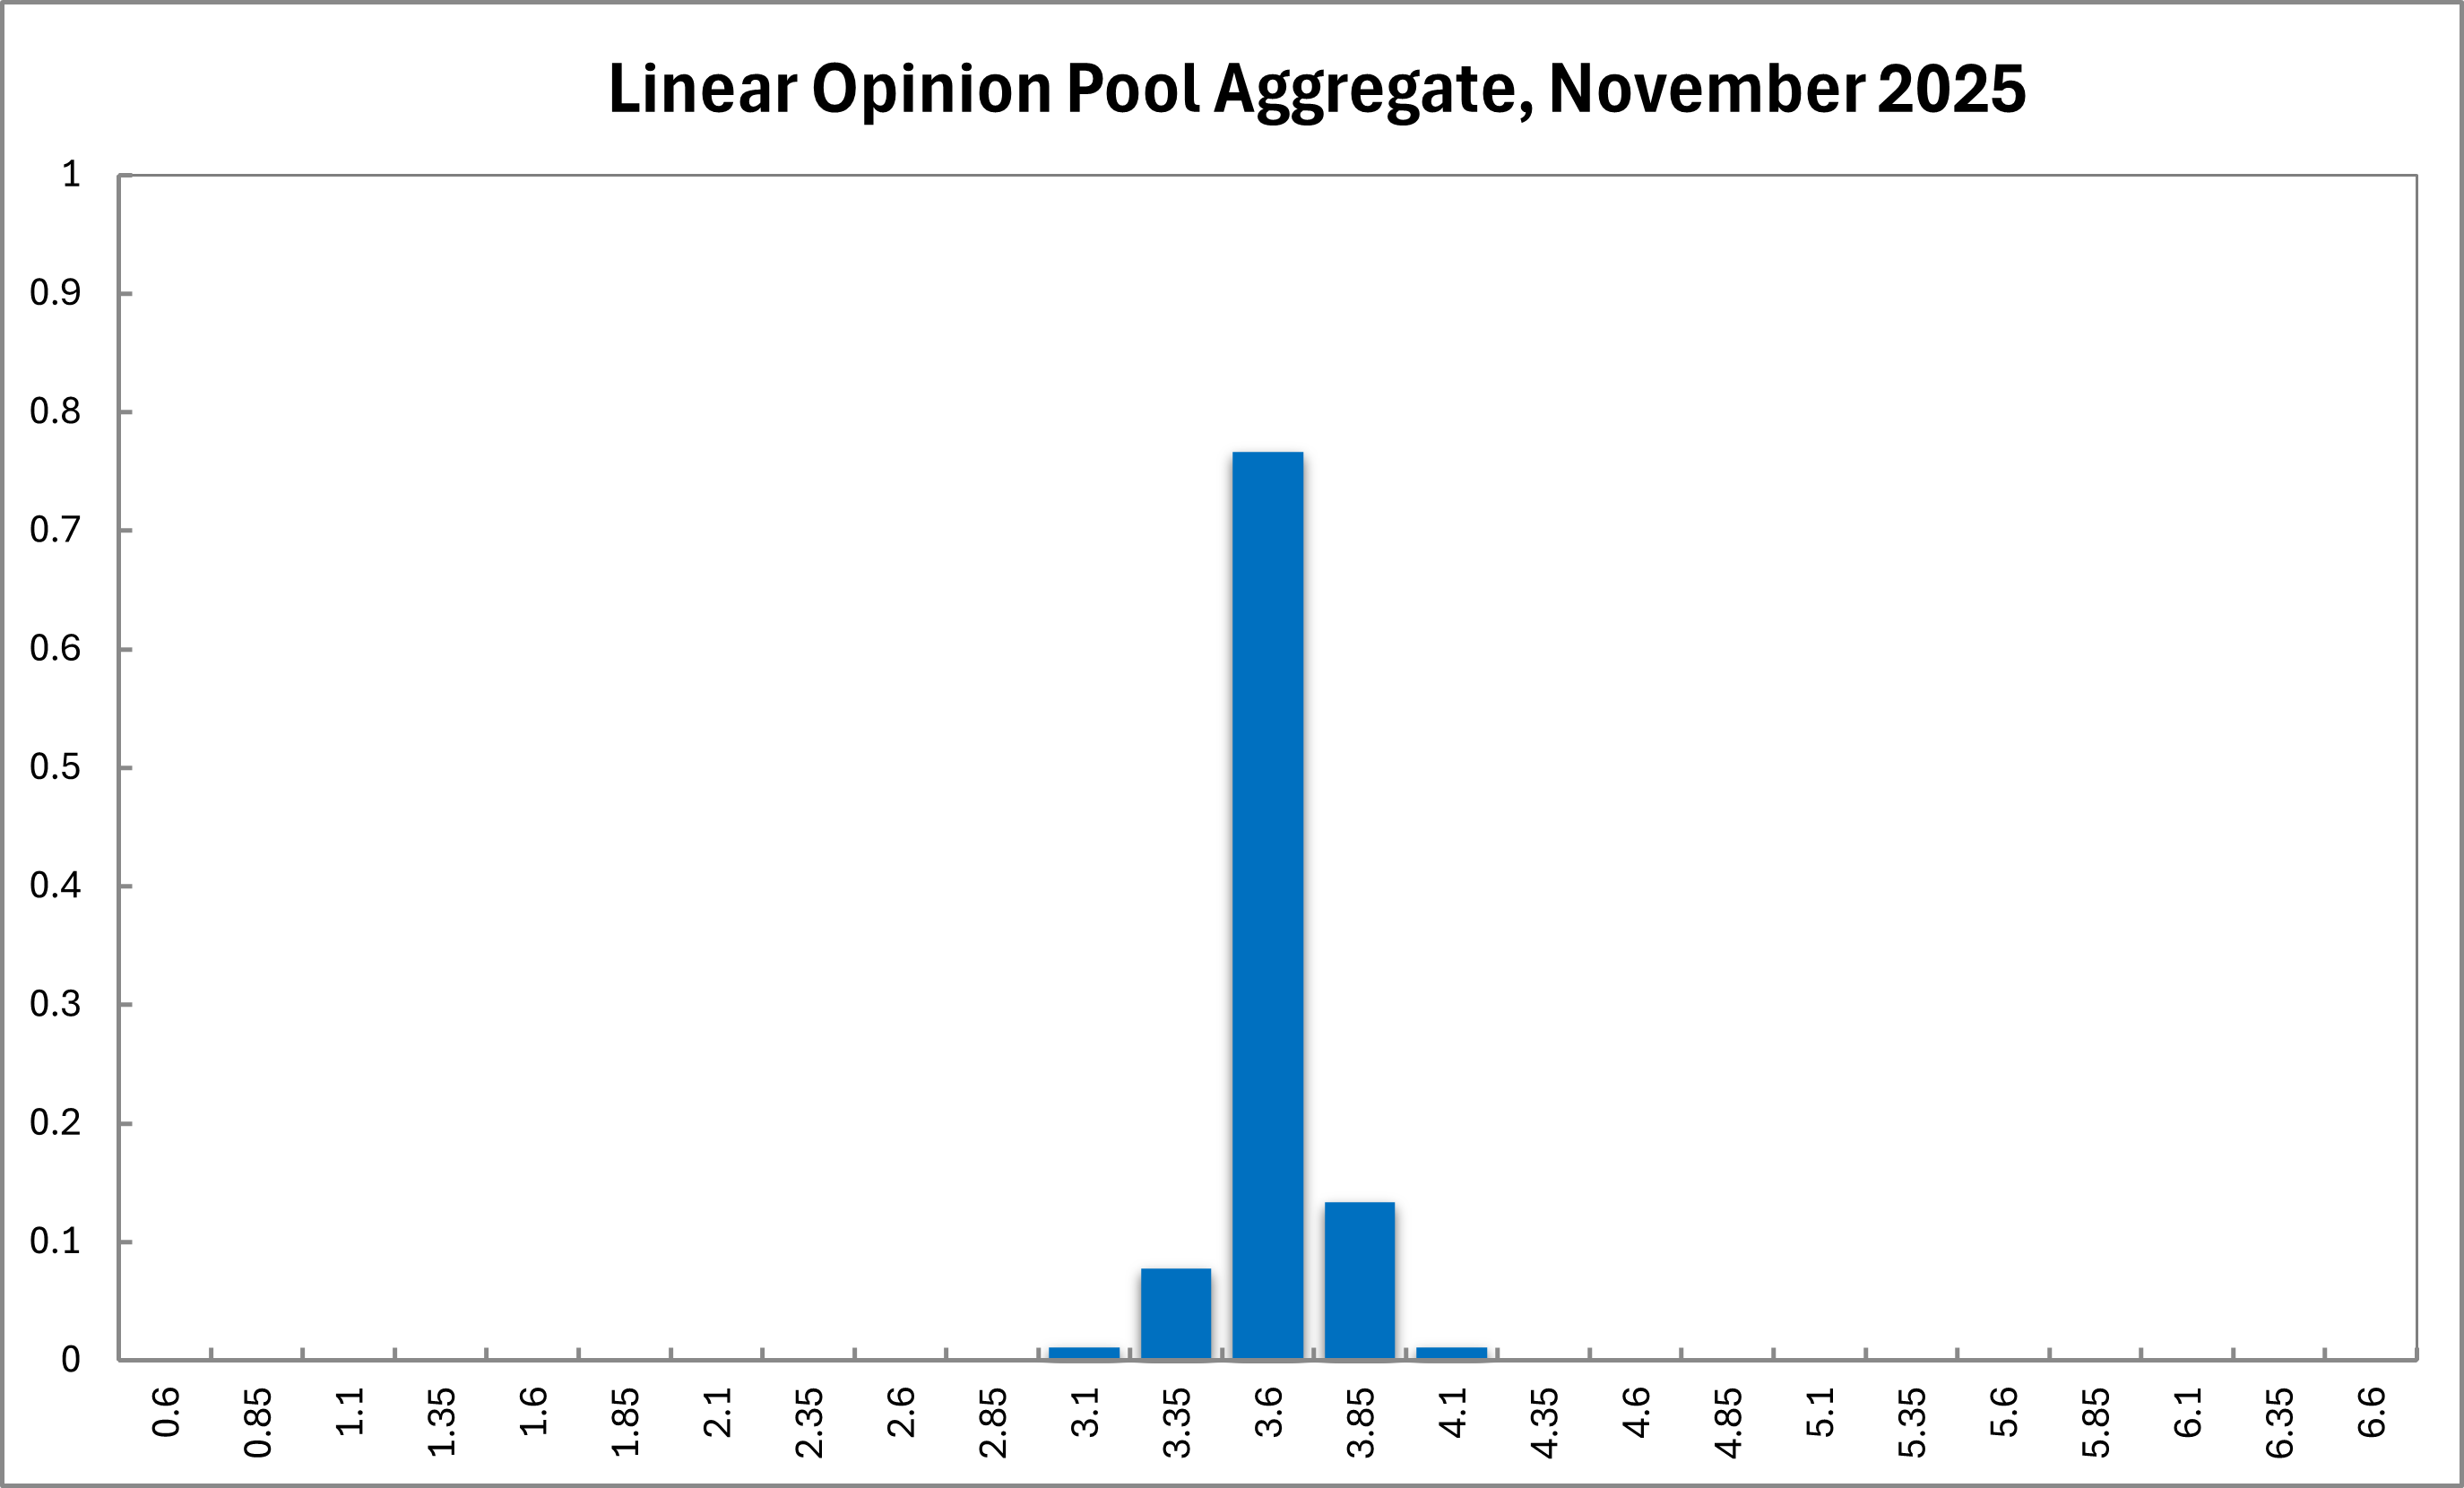
Australia’s inflation rate unexpectedly increased in the September quarter. Headline CPI rose 1.2% q/q and 3.5% y/y on the monthly indicator in September (from 3.0% y/y in August), while the ABS’s trimmed mean accelerated to 1.0% q/q and 3.0% y/y—the first annual uptick since late-2022 and, importantly, above the RBA’s 2-3% target band again after dipping within it mid-year. The monthly “ex-volatile items and holiday travel” gauge advanced to 3.7% y/y, pointing to persistent underlying price pressures even as earlier goods disinflation fades. These developments, alongside a softening labour market and still-subdued private demand indicators, frame a finely balanced policy backdrop this round. Consequently, there is a strong and growing consensus among Shadow Board members to keep the overnight rate unchanged at 3.60 per cent, attaching a 77 per cent probability that this is the appropriate setting, with the remaining probability mass distributed more towards a rate hike (14 percent) than a rate cut (9 per cent).
Labour market conditions have eased further. In September, the seasonally adjusted unemployment rate rose to 4.5% (from a revised 4.3% in August) as participation edged up to 67.0%. Employment increased modestly (+15,000 overall, split between +8,700 full-time and +6,300 part-time), and underemployment ticked up to 5.9%; monthly hours worked lifted to 1,987 million but remain below peaks earlier in the year. These data suggest labour demand is softening gradually rather than collapsing, consistent with a shift from a tight jobs market toward one with a little more slack. Forward indicators are mixed: job ads and vacancies have stabilised but no longer point to strong incremental gains.
Financial markets are pricing disinflation with a growth downshift rather than a hard landing. The Australian dollar has traded mostly in the range between US$0.65 and US$0.66 in late October, while the ASX 200 hovered near 8,890 after a choppy month. In rates, the 10-year Commonwealth yield finished October near 4.31% and the 2-year around 3.57%, leaving the very short end slightly inverted but the yield curve with normal convexity further out (10y–2y spread ≈ +74 bps; 5y–2y mildly positive), consistent with expectations of inflation converging and policy easing only gradually.
Household sentiment slipped back and remains clearly below its long-run average. The Westpac–Melbourne Institute Consumer Sentiment Index fell 3.5% m/m to 92.1 in October (neutral = 100), its lowest in six months, reversing gains earlier in the year. Detail shows broad-based softness: “family finances next 12 months” and “economy next 12 months” weakened, while willingness to buy major household items also edged lower; house-price expectations, however, remain elevated. Unemployment expectations are roughly around average, consistent with a labour market that is cooling but not collapsing. These readings align with Trading Economics’ compilation showing the headline index at 92.1 in October (from 95.4) and reinforce a cautious near-term consumption outlook as real borrowing costs stay restrictive.
Business surveys portray resilient current activity but softer forward signals. NAB’s September Monthly Survey reported business confidence at +7 (above its long-run average) with conditions still solid, yet forward orders fell three points back into negative territory—an early sign of moderating demand. Capacity utilisation edged up to the highest since May 2024, suggesting firms are still operating at relatively high levels despite pockets of softness; cost indicators were mixed, with purchase prices and overall output prices rising marginally month-on-month while labour-cost growth eased. PMI data corroborate ongoing expansion: the S&P Global Composite Output Index rose to 52.6 in October (from 52.4). Additional NAB quarterly reads show capacity utilisation lifting to about 81% in Q3 (back above its historical average) and SMEs’ forward indicators improving, though firms continue to cite wage costs and margin pressure as key headwinds. Taken together, conditions point to steady near-term activity with some cooling in pipeline orders rather than an abrupt downturn.
Globally, the IMF’s October World Economic Outlook characterises a backdrop of “subdued” growth amid persistent uncertainty. The Fund projects world GDP to ease from 3.3% in 2024 to 3.2% in 2025 and 3.1% in 2026, with advanced economies around 1½% and EMDEs just above 4%. Headline inflation is expected to decline further, albeit with above-target outcomes in some advanced economies and risks tilted to the upside. The report acknowledges the fillip to U.S. growth from AI-related investment but highlights lingering protectionism, elevated policy uncertainty and fiscal vulnerabilities as key downside risks, alongside the potential for financial-market corrections if tech-heavy equities were to reprice. For Australia, the implication is a global expansion supporting domestic production but with softer world trade and a risk mix that argues for caution. Current modest tailwinds from weakening commodities prices and lower goods trade volumes could increase.
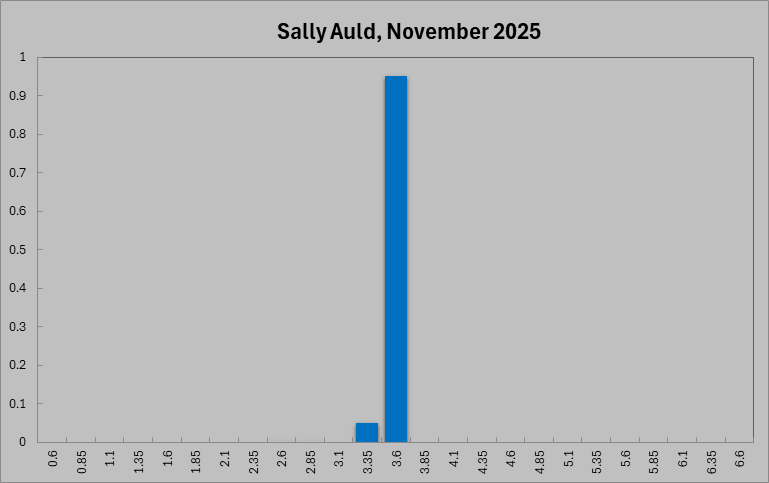
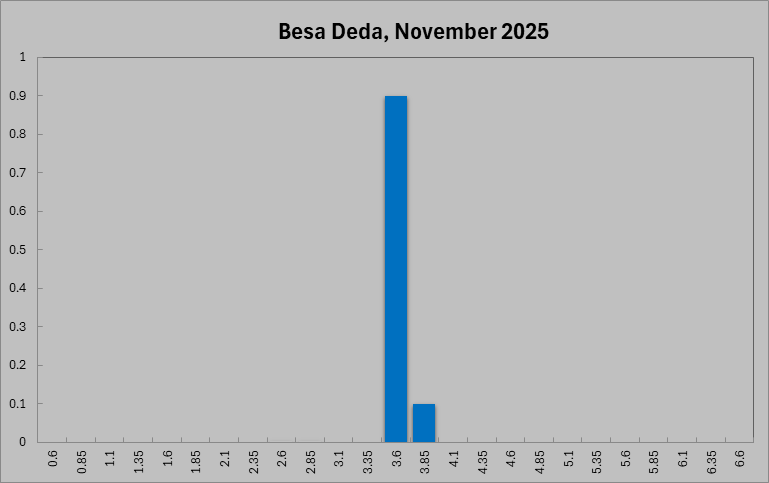
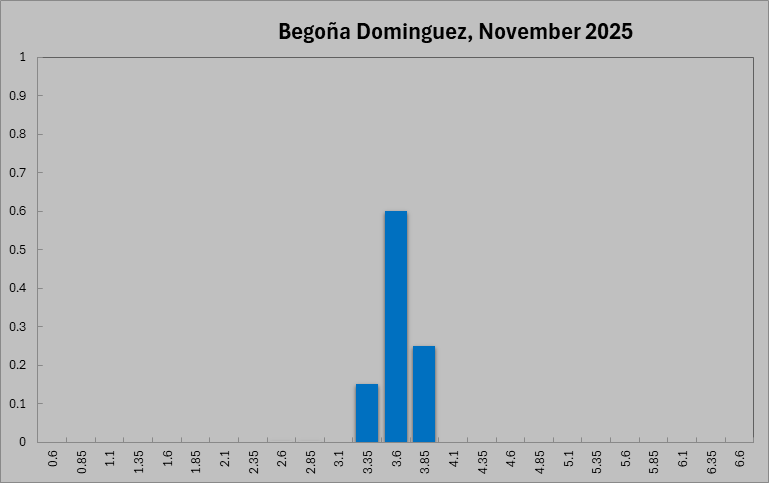
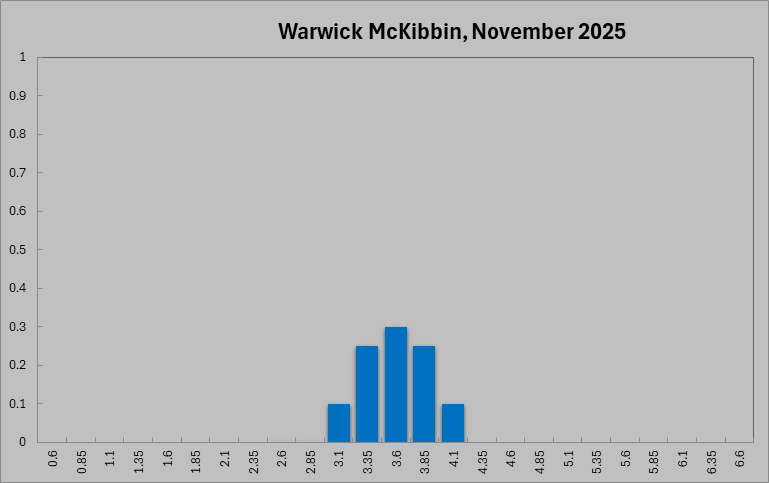
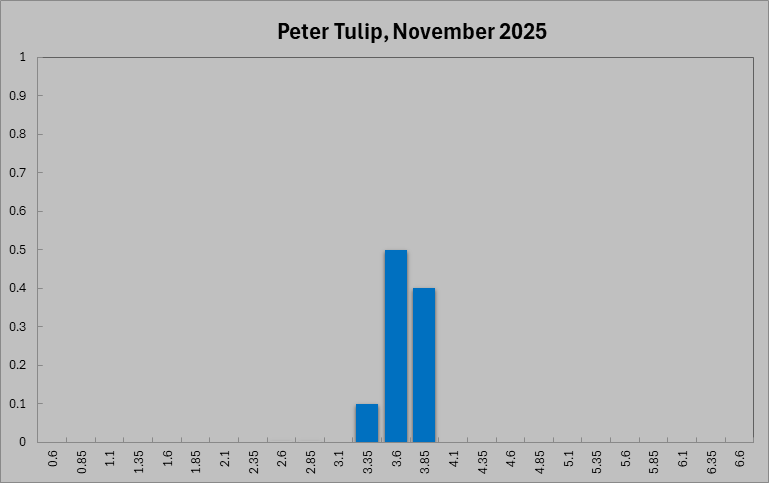
The Shadow Board assigns a 77 per cent probability that holding the overnight rate at 3.6 per cent is optimal (71 per cent in the previous round), a 9 per cent probability that reducing the overnight rate to 3.6% is appropriate (15 per cent in previous round), and a 14 per cent probability that raising the rate above 3.60 per cent is warranted (unchanged). Hence, there is a strong and growing consensus to keep the policy rate unchanged.
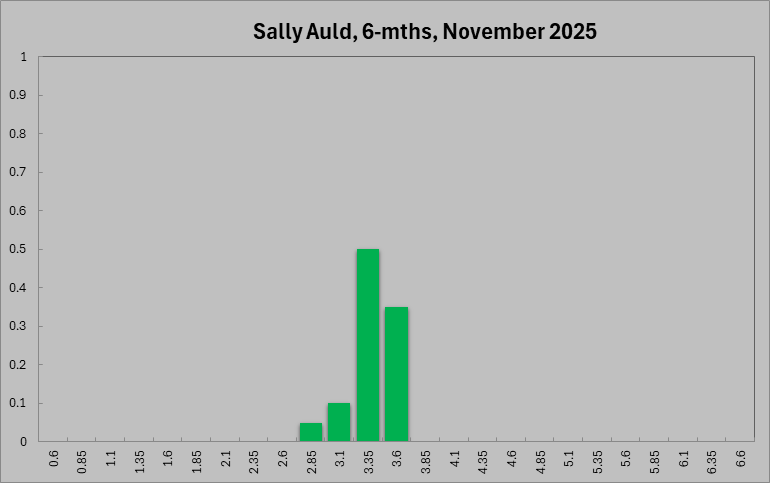
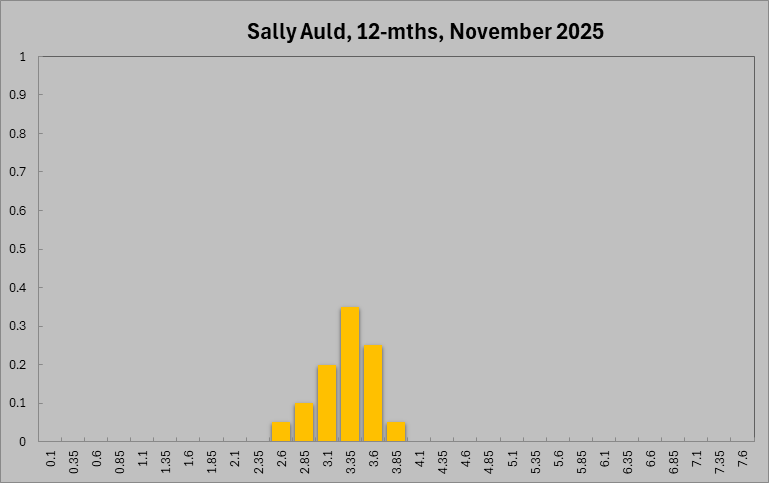
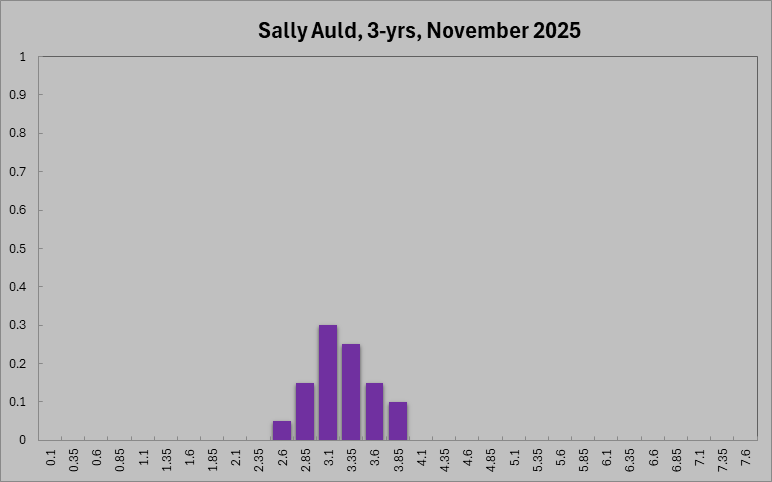
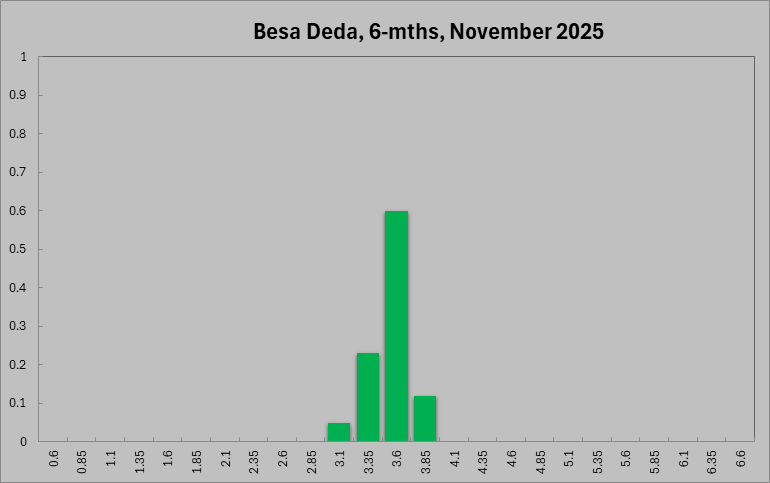
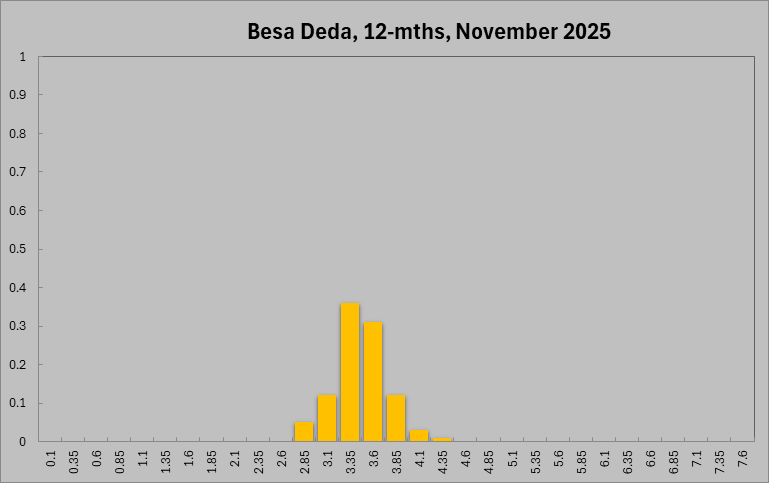
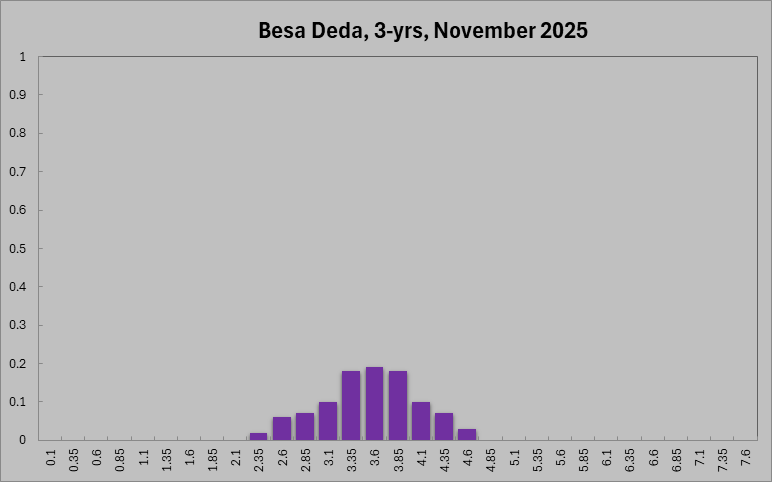
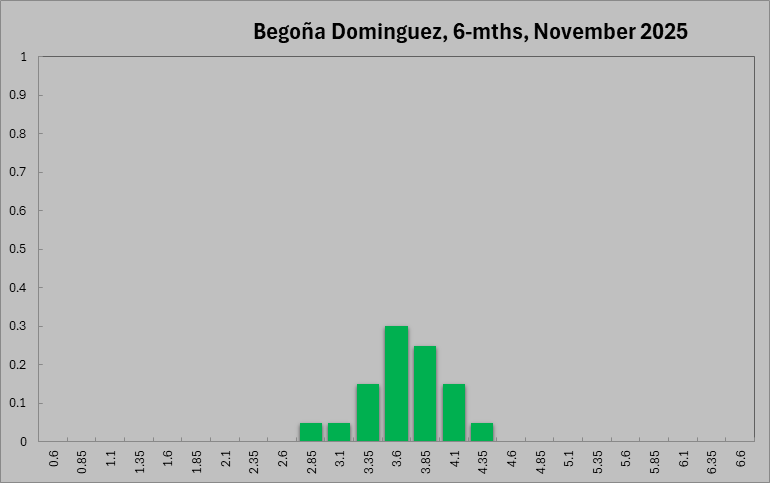
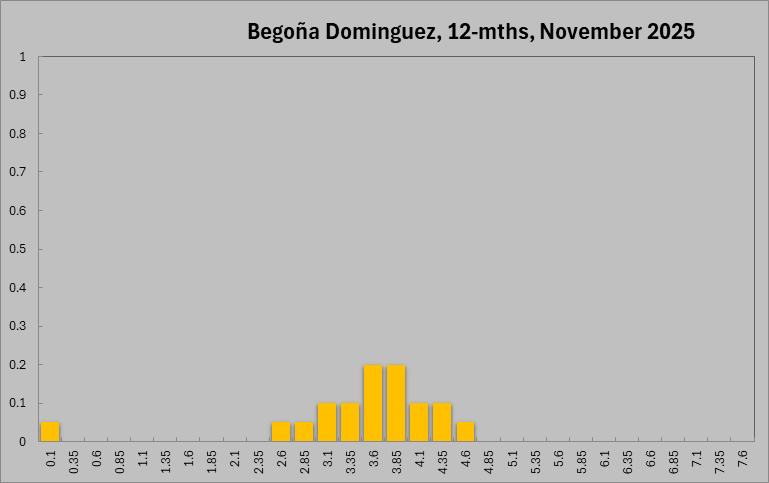
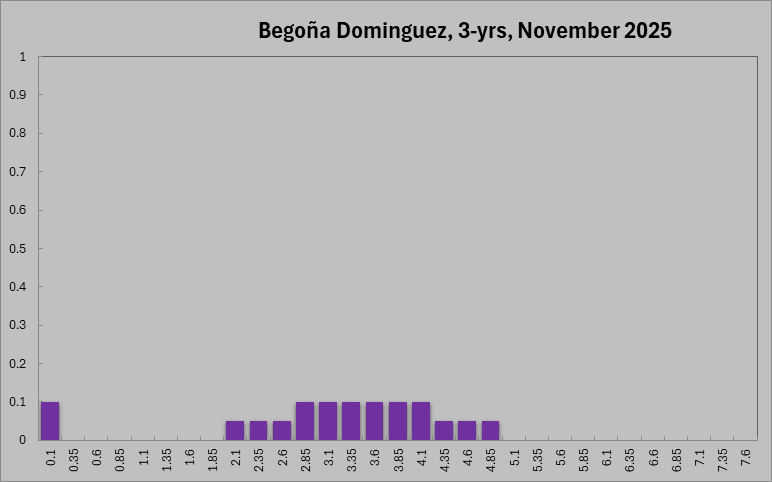
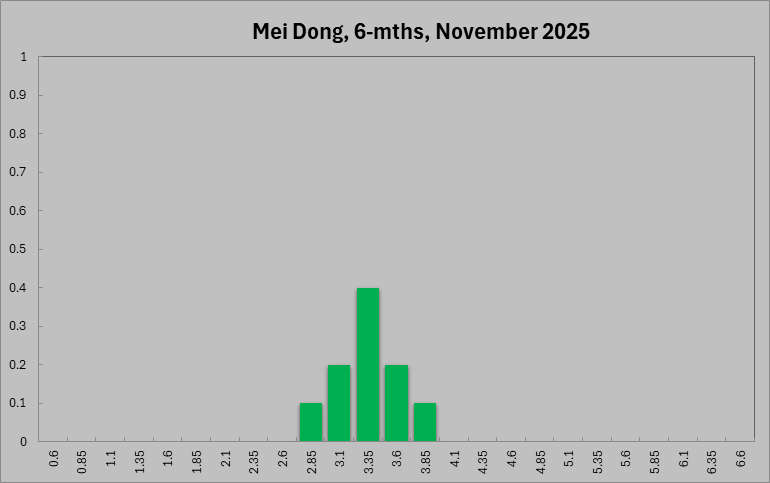
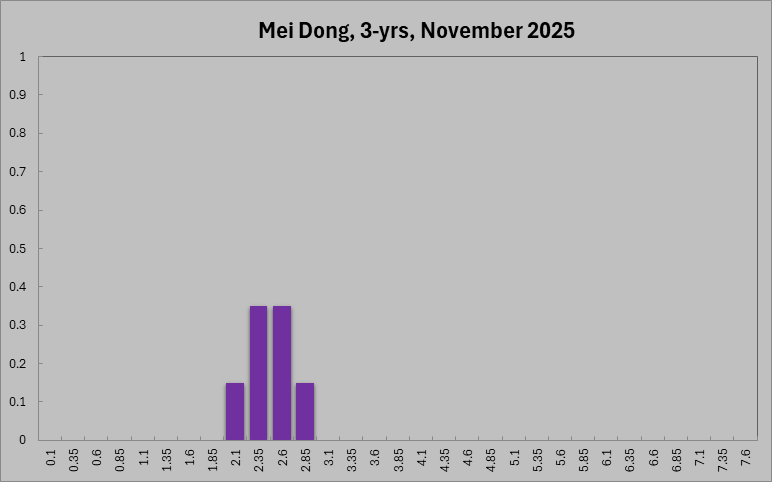
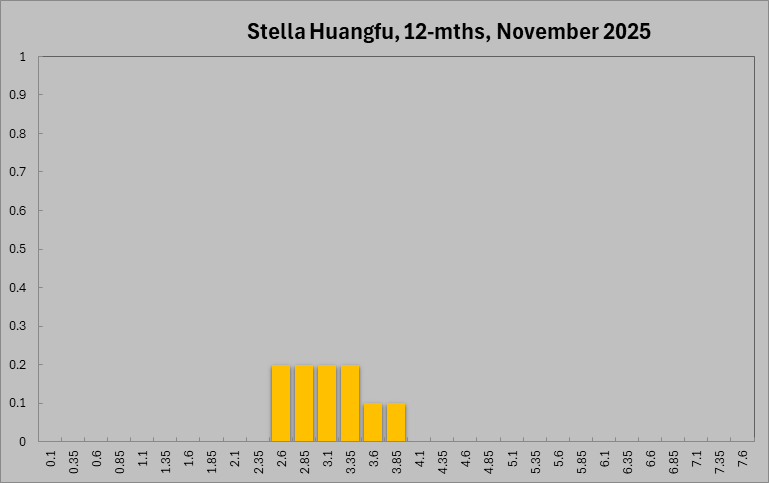
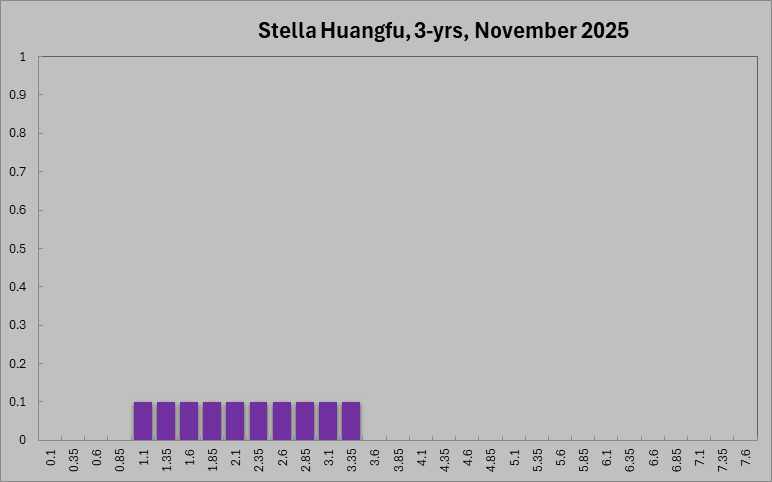
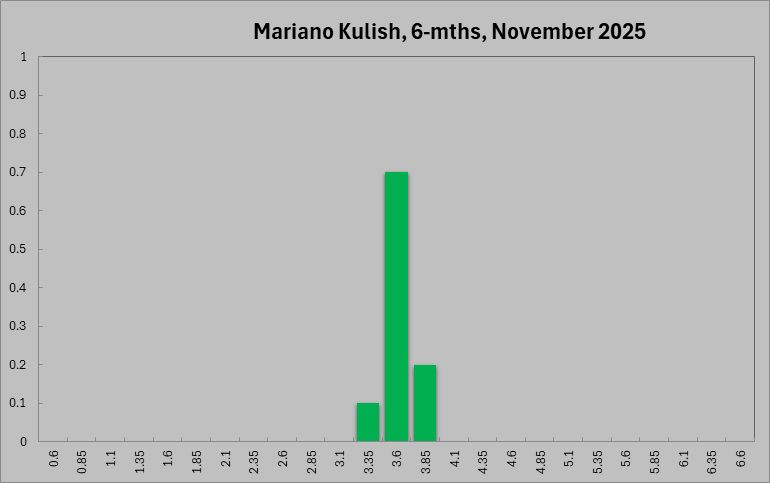
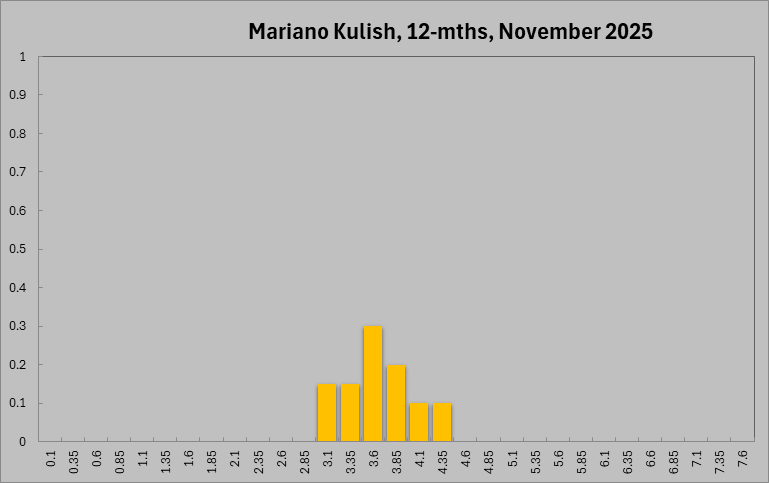
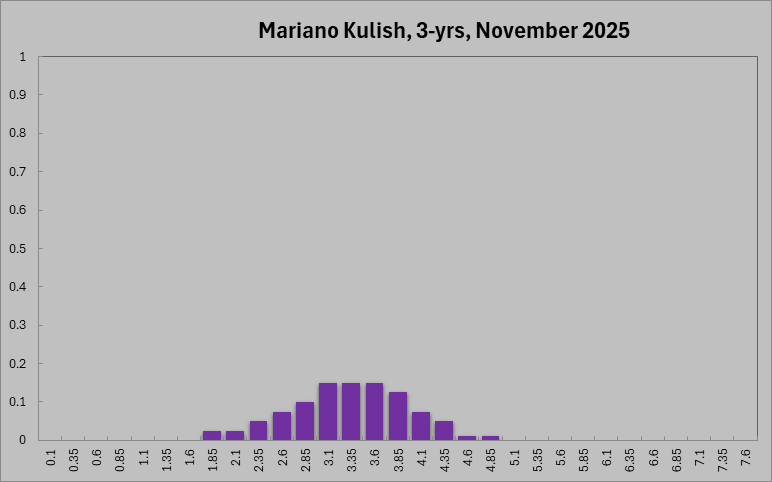
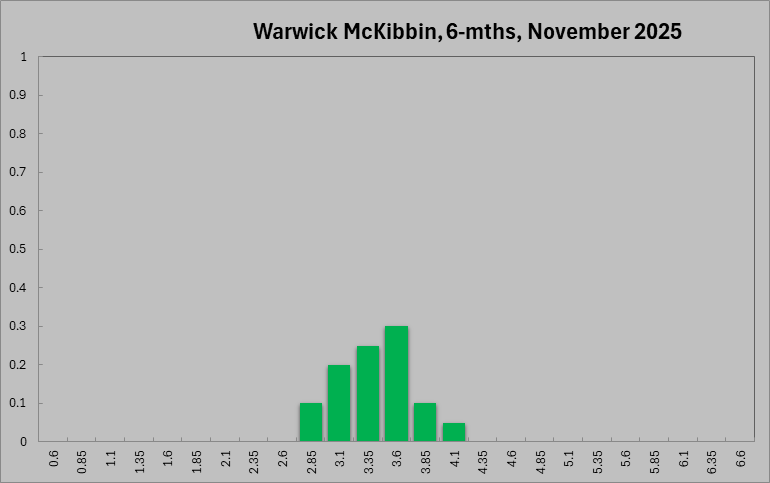
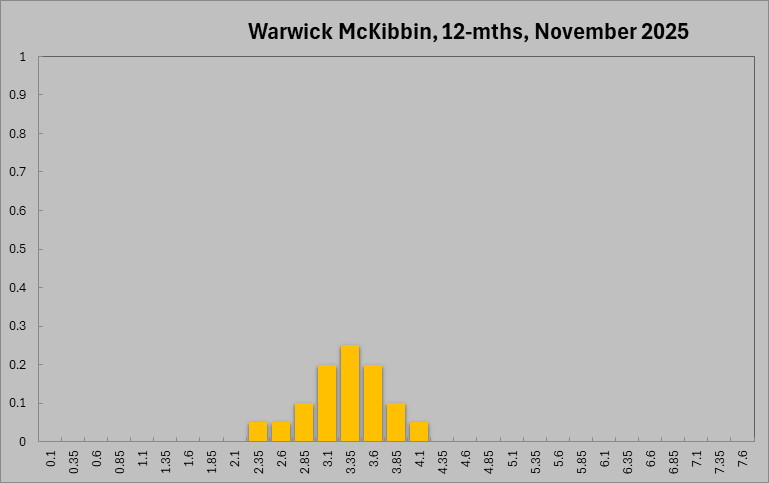
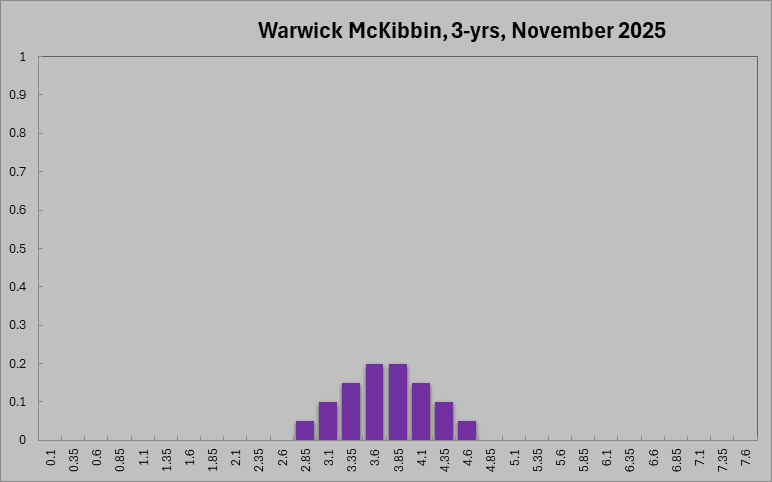
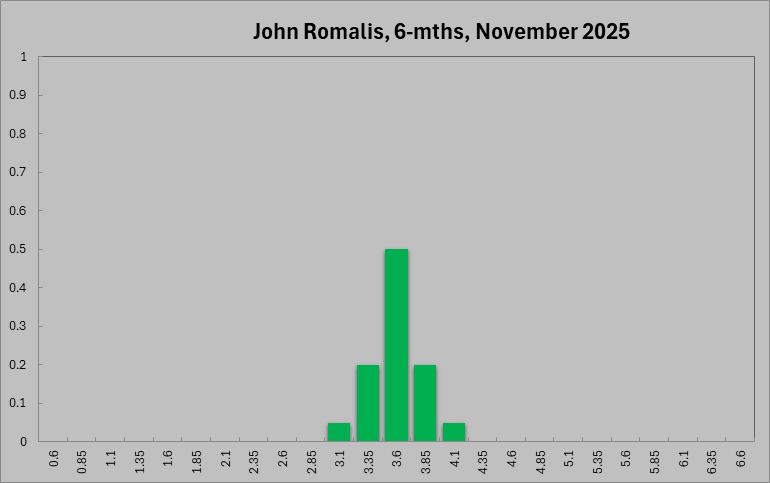
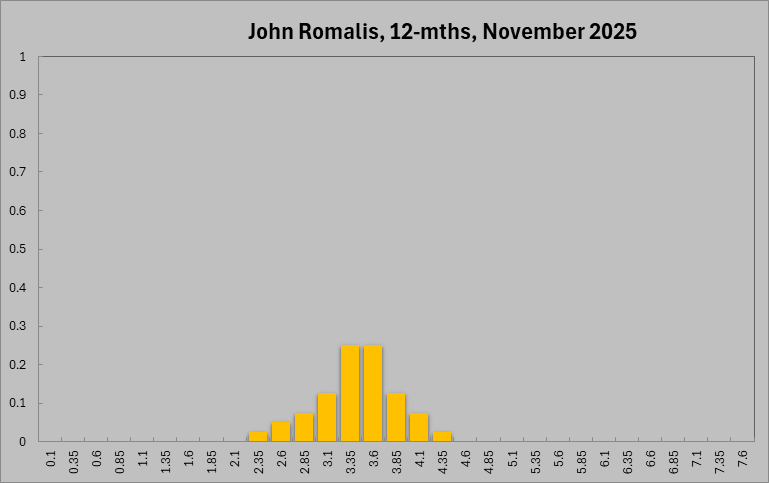
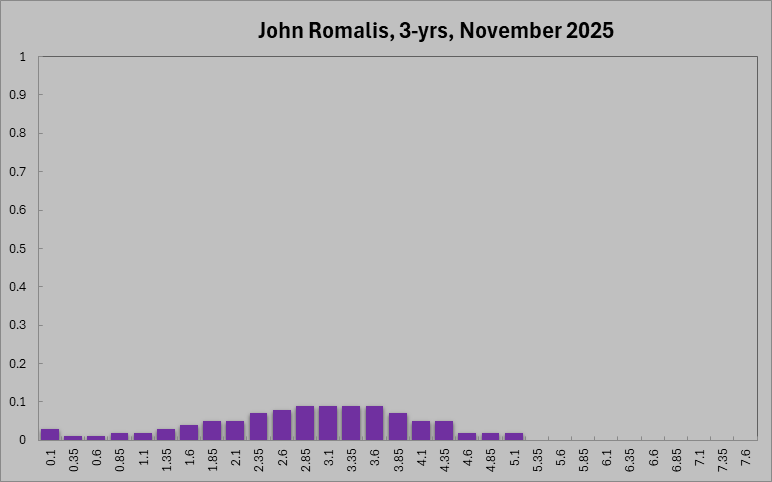
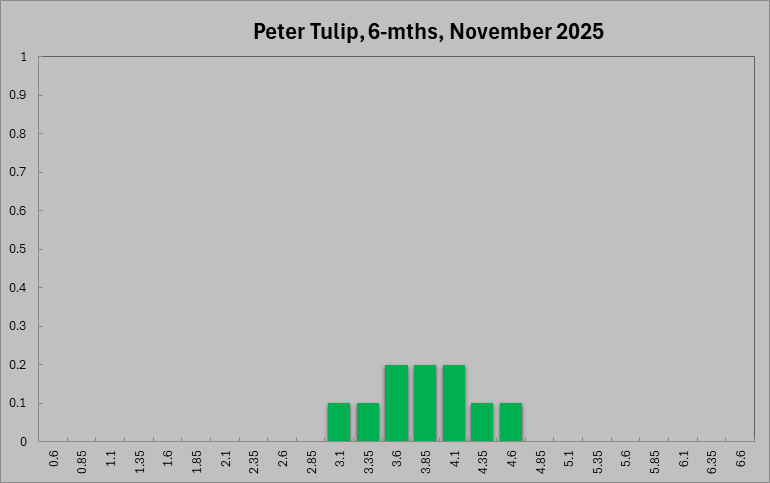
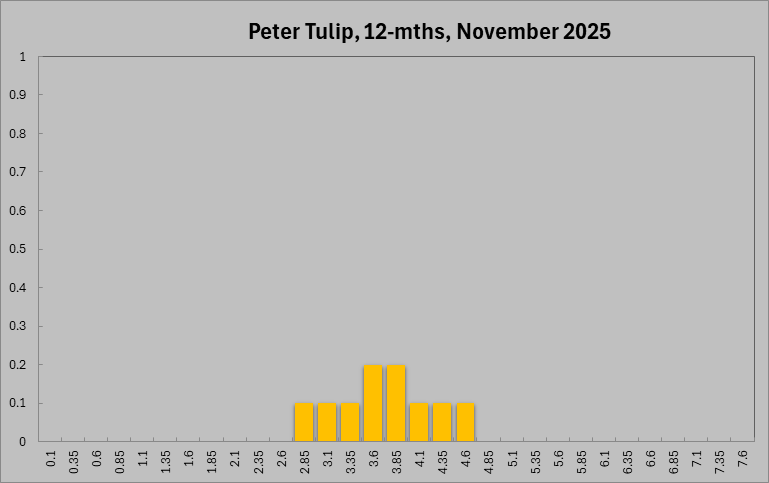
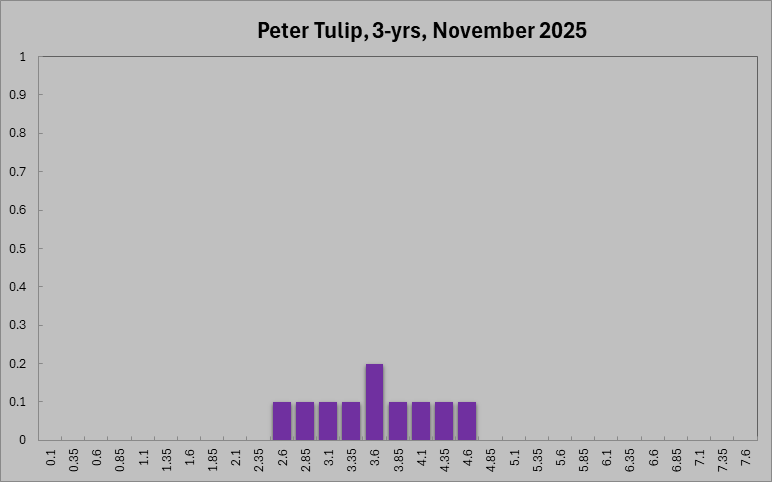
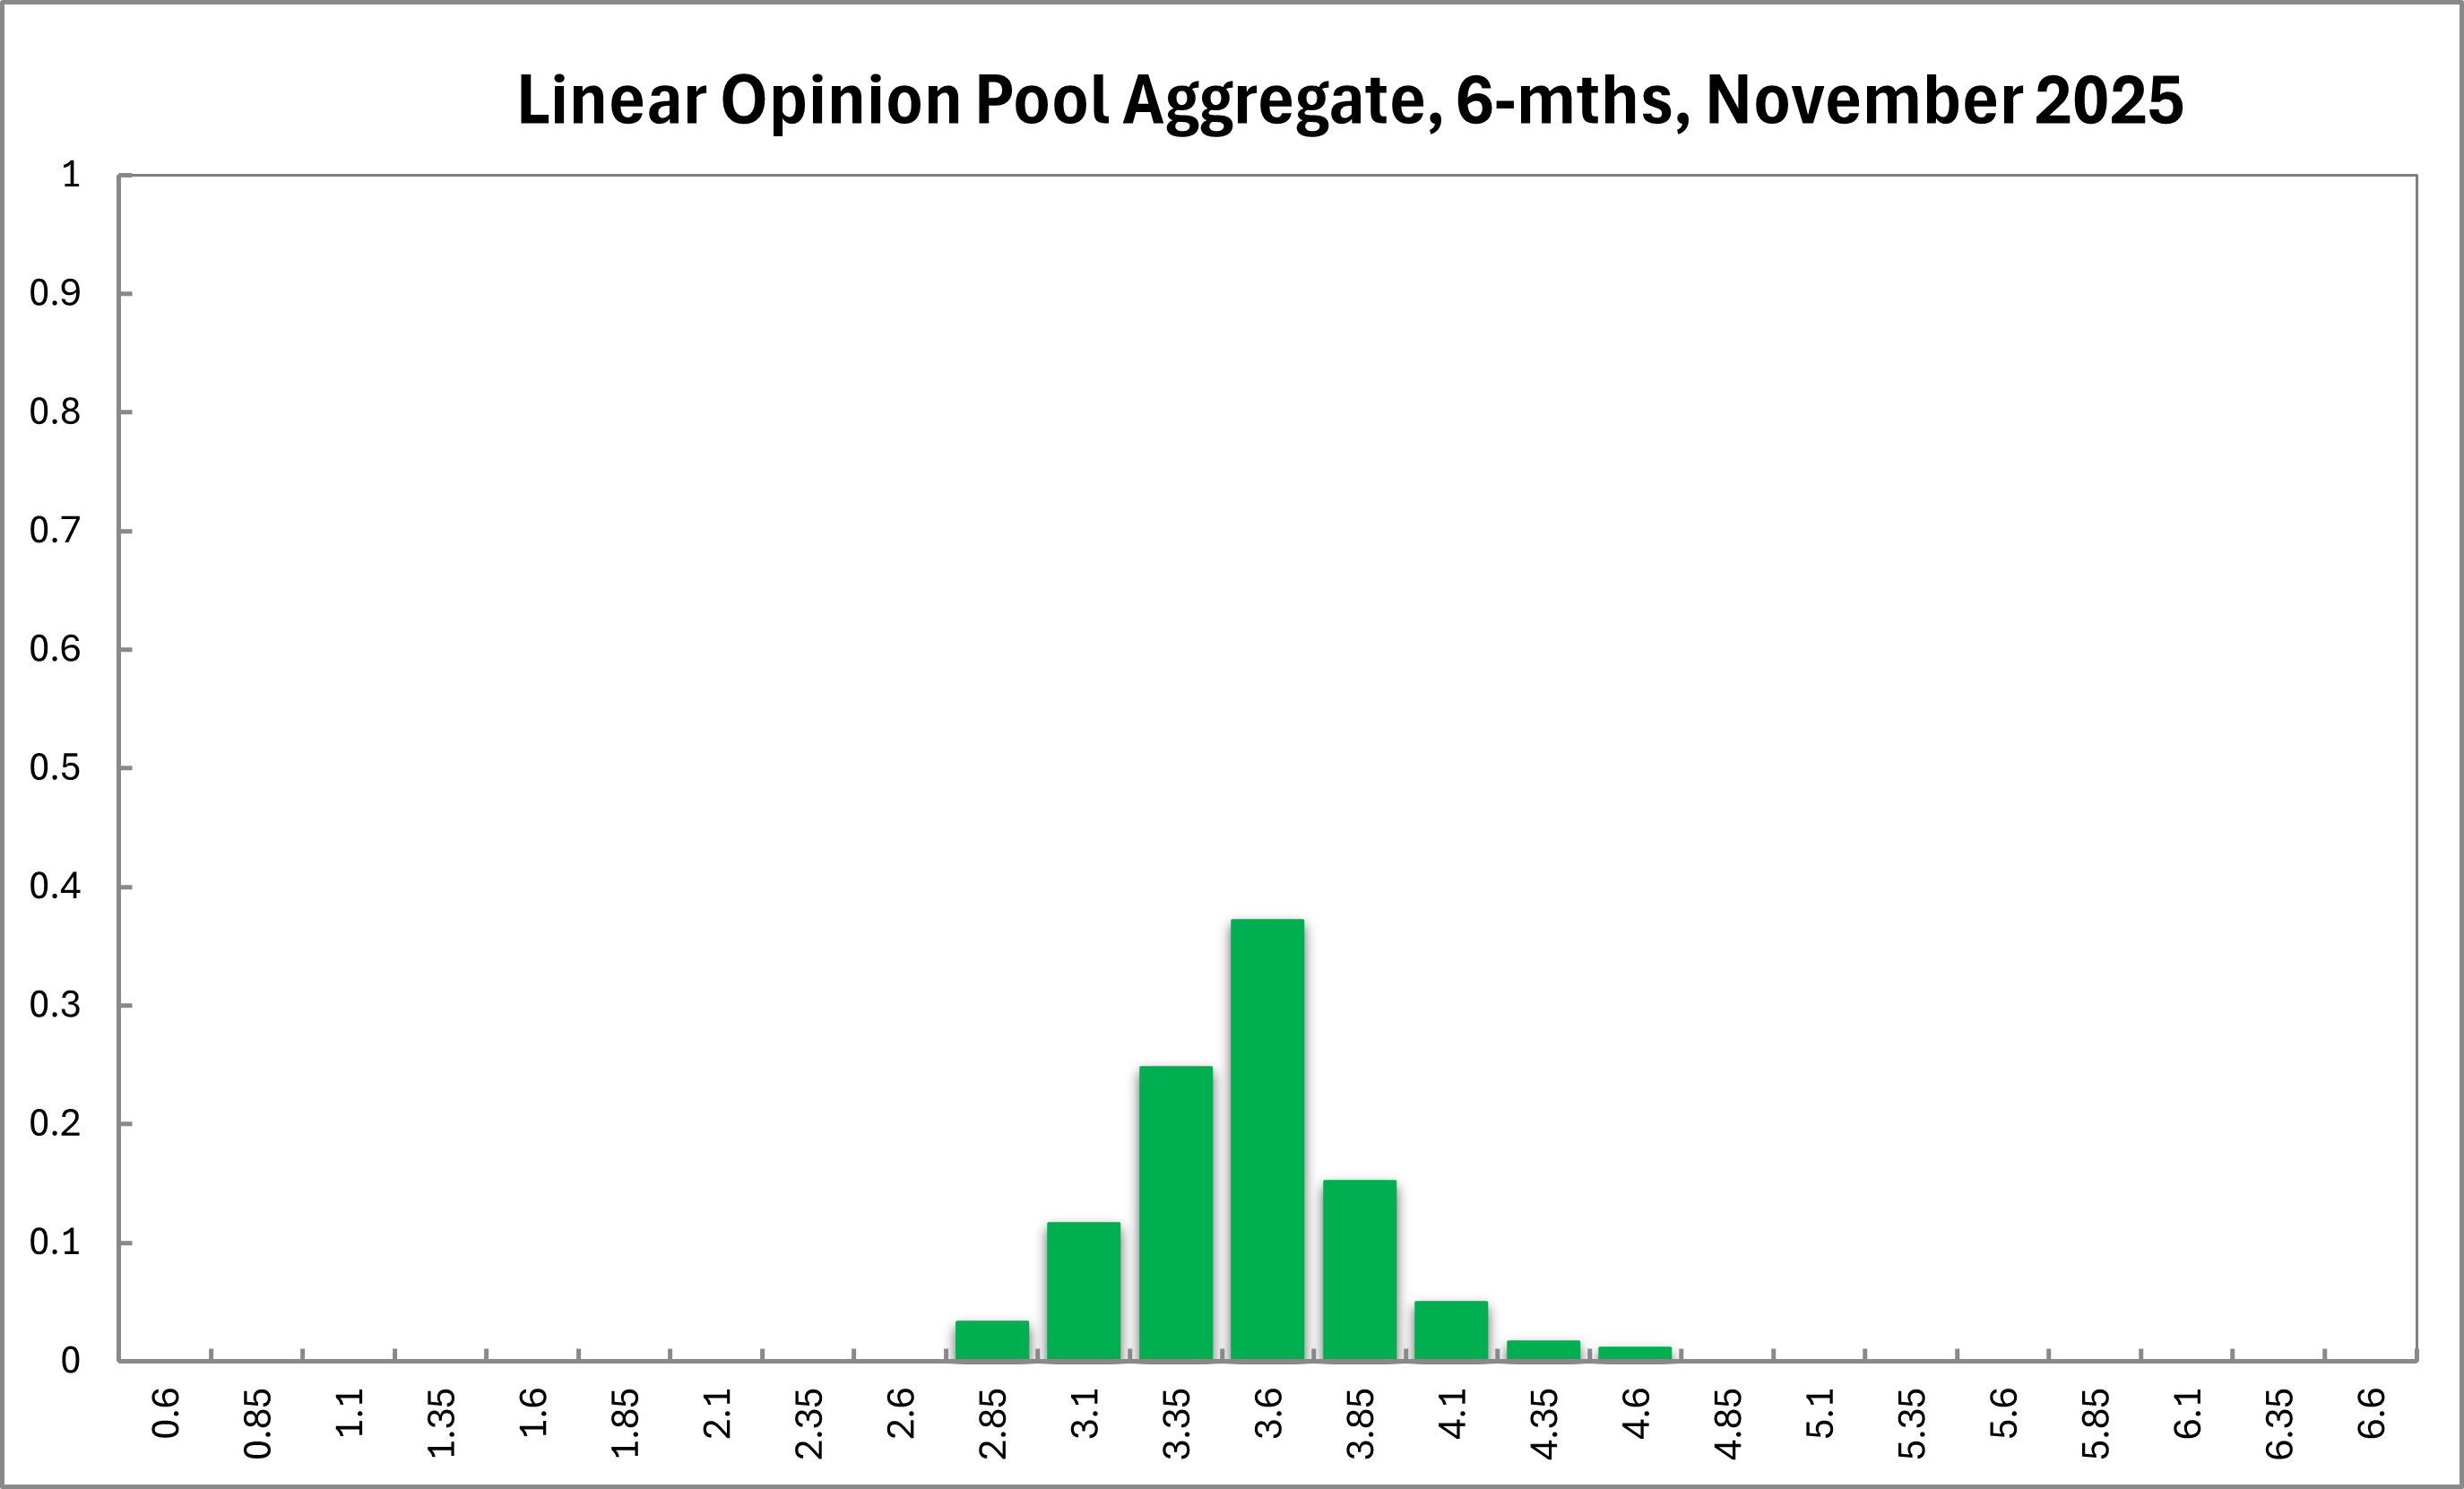
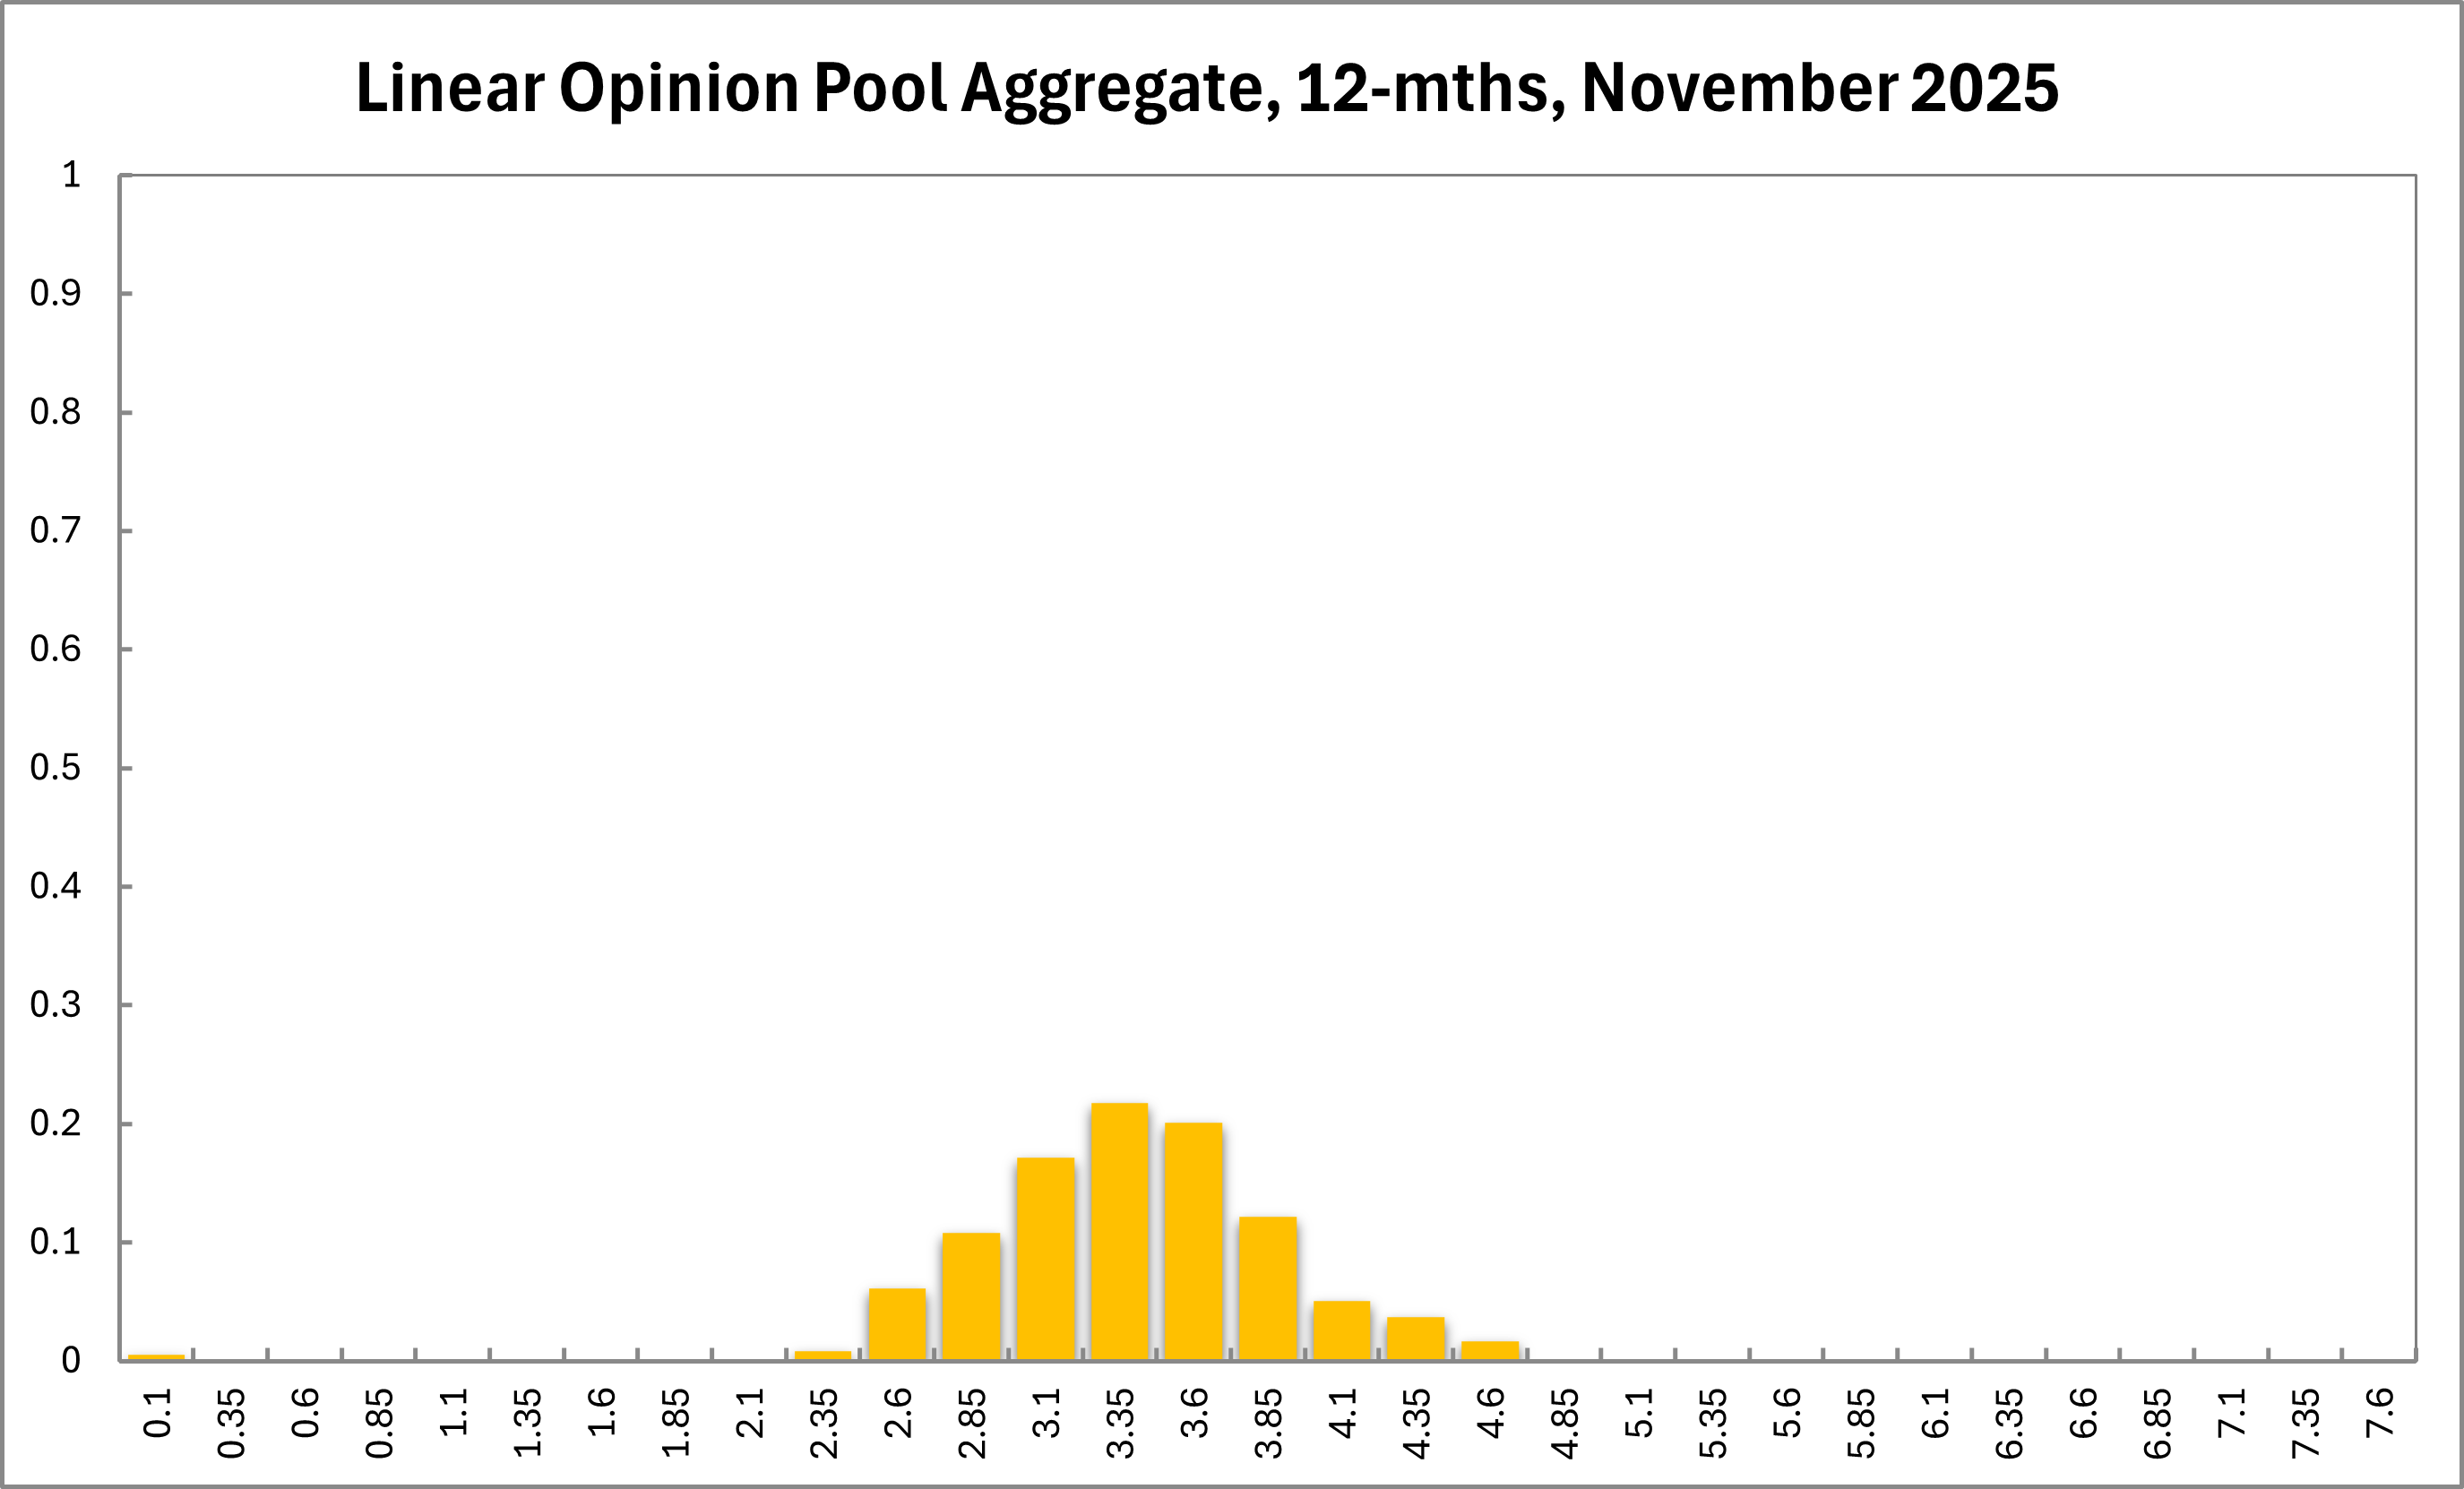
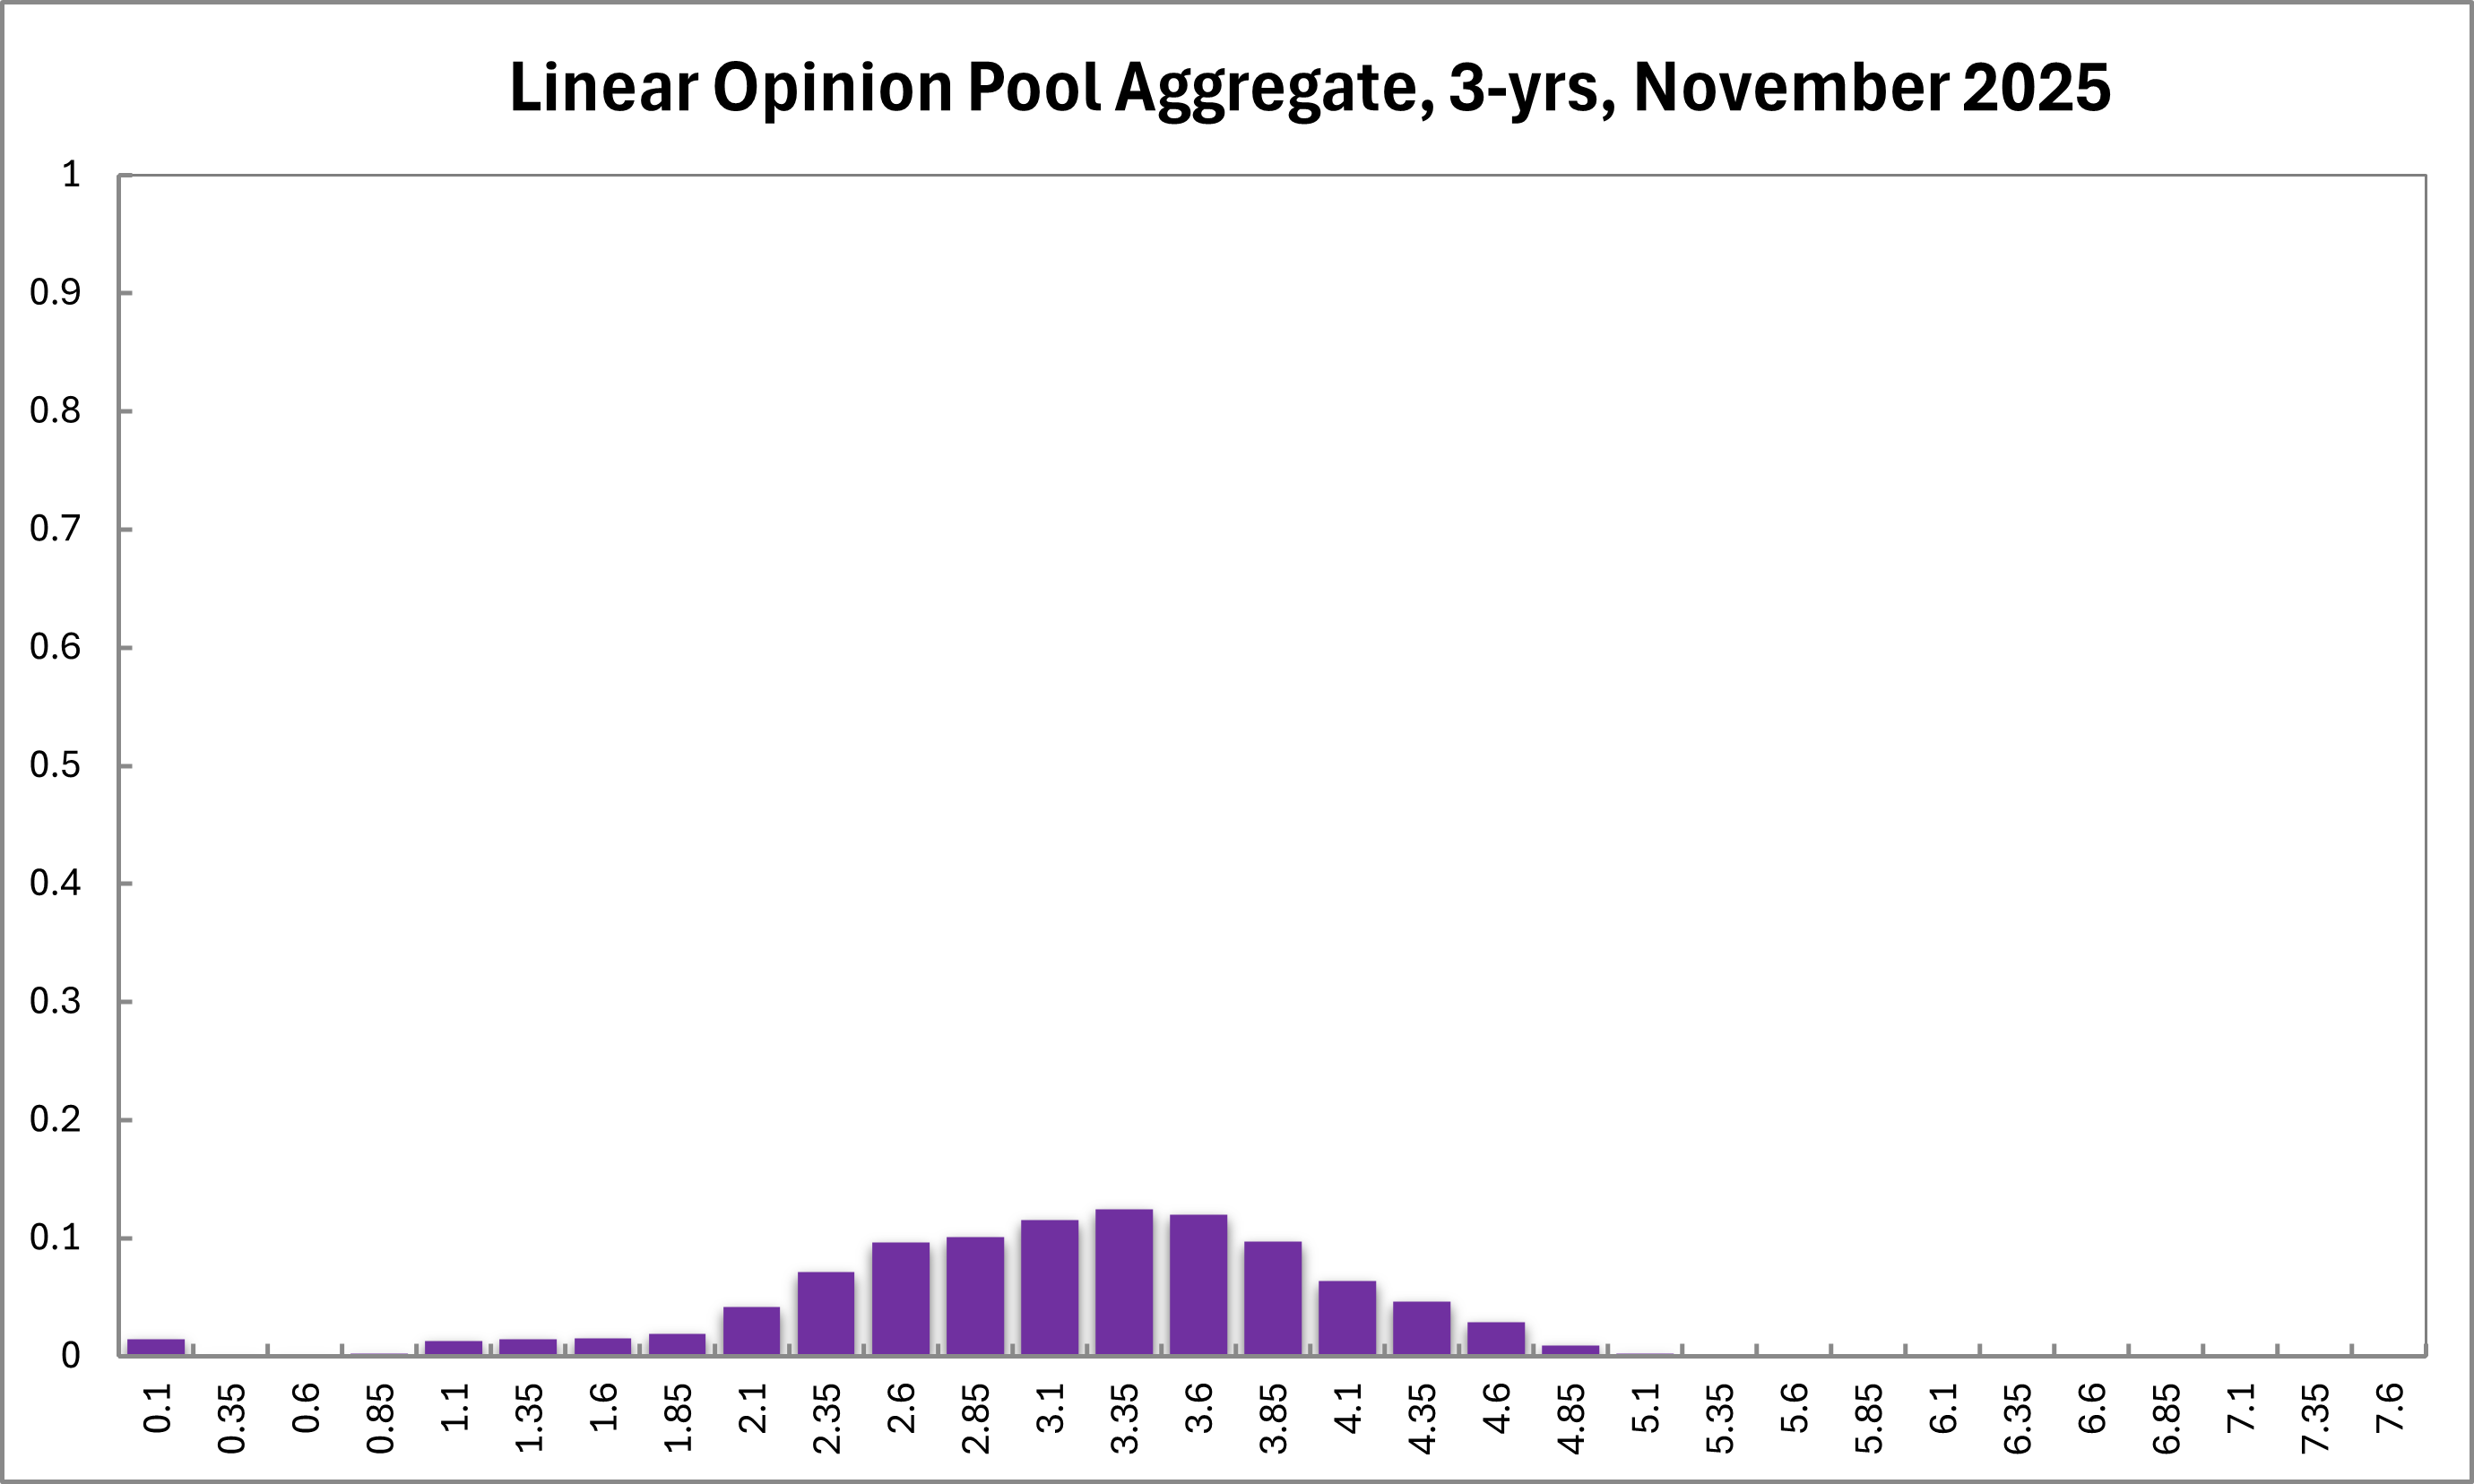
Six months out, the Board attaches a 40 per cent probability that the cash rate should be lower than the current setting of 3.60 per cent (58 per cent in previous roun), 37 per cent that the current setting is optimal (24 per cent), and 23 per cent that a higher rate is required (17 per cent). At the 12-month horizon, probabilities are 57 per cent for a lower interest rate (63 per cent), 20 per cent for a rate hold (13 per cent), and 23 per cent for a higher rate (24 per cent). Three years out, the Board attaches a 63 per cent probability of a lower rate being optimal, 12 per cent to the current setting, and 25 per cent to a higher rate.
The distribution for the current recommendation remained unchanged at 3.10%–4.10% band. For the 6-month horizon, the distribution narrowed and shifted up, to 2.85%–4.60%. At longer horizons, the implied ranges are unchanged, at 0.10%–4.60% (twelve months), and 0.10%–5.10% (three years).